Visualizing our Deployment Pipeline

Cross posted also here: http://techblog.outbrain.com/2011/08/visualizing-our-deployment-pipeline/
When large numbers start piling up, in order to make sense of them they need to be visualized.
I still work as a consultant at outbrain about one day a week and most of the time I’m in charge of the deployment system last described here.
The challenges encountered when developing the system are good challenges, every day we have too many deployments to be easily followed; so I decided to visualize them.
On an average day we usually have  a dozen or two deployment (to production, not including test clusters) so I figured why don’t I use my google-visualization-fu and draw some nice graphs. Here are the results and explanations follow.
BTW, before I begin, just to put things in context, outbrain had been practicing  Continuous Deployment for a while (6 months or so) and although there are a few systems that helped us get there, one of the main pillars was a relatively new tool written by the fine folks at LinkedIn (and in particular Yan, thanks Yan), so just wanted to give a fair shout out to them and thank Yan for the nice tool, API and ongoing awesome support. If you’re looking for a deployment tool do give glu a try, it’s pretty awesome! Without glu and it’s API all the nice graphs and the rest of the system would not have seen the light of day.


The Annotated Timeline

This graph may seem intimidating at first, so don’t be scared and let’s dive right into it… BTW, you may click on the image to enlarge it.

First, let’s zoom in to the right hand side of the graph. BTW, this graph uses google’s annotated timeline graph which is really cool for showing how things change over time and correlate them to events, which is what I do here – the events are the deployments and the x axis is the time while the y is the version of the deployed module.
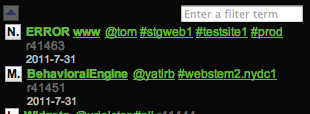
On the right hand side you see a list of deployment events, for example the one at the top has “ERROR www @tom…” and the one next is “BehavioralEngine @yatirb…” etc. This list can be filtered so if you type a name of one of the developers such as @tom or @yatirb you see only the deployments made by him (of course all deployments are made by devs, not by ops, hey, we’re devopsy, remember?).
If you type into the filter box only www you see all the deployments for the www component, which by no surprise is just our website.
If you type ERROR you see all deployments that had errors (and yes, this happens too, not a big deal)
The nice thing about this graph from is first that while you filter the elements on the graph that are filtered out dissapear, so for example let’s see only deployments to www (click on the image to enlarge):
You’d notice that not only the right hand side list is shrunk and contains only deployments to www, but also the left hand side graph now only has the appropriate markers. The rest of the lines are still there but only the markers for the www line are on the graph right now.
Now let’s have a look at the graph. One of the coolest things is that you can zoom in to a specific timespan using the controls at the lower part of the graph. (click to enlarge)

In this graph the x axis shows the time (date and time of day) and the y axis shows the svn revision number. Each colored line represents a single module (so we have one line for www and one line for the BehavioralEngine etc).

What you would usually see is for each line (representing a module) a monotonically increasing value over time, a line form the bottom left corner towards the top right corner, however, in relatively rare cases where a developer wants to deploy an older version of his module, then you clearly see it by the line suddenly dropping down a bit instead of climbing up; this is really nice, helps find unusual events.


The Histogram

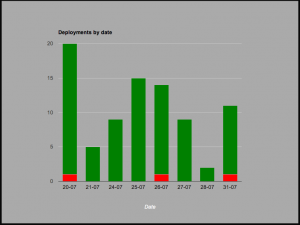
In the next graph you see an overview of deployments per day. (click to enlarge)

This is more of a holistic view of how things went the last couple of days, it just shows how many deployments took place each day (counts production clusters only) and colors the successful ones in green and the failed ones in red.

This graph is like an executive summary that can tell the story of – in case there are too many reds (or there are reds at all), then someone needs to take that seriously and figure out what needs to be fixed (usually that someone is me…) – or in case the bars aren’t high enough, then someone needs to kick developer’s buts and get them deployin somethin already…

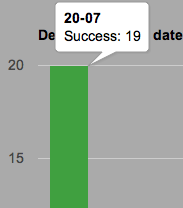
Like many other graphs from google’s library (this one’s a Stacked Column Chart, BTW), it shows nice tooltips when hovering over any of the columns with their x values (the date) and their y value (number of successful/failed deployments)


Versions DNA Mapping

The following graph shows the current variety of versions that we have in our production systems for each and every module. It was attributed as a DNA mapping by one of our developers b/c of the similarity in how they look but that’s how far this similarity goes…

The x axis lists the different modules that we have (names were intentionally left out, but you can imaging having www and other folks there). The y axis shows the svn versions of them in production. It uses glu’s live model as reported by glu’s agents to zookeeper.

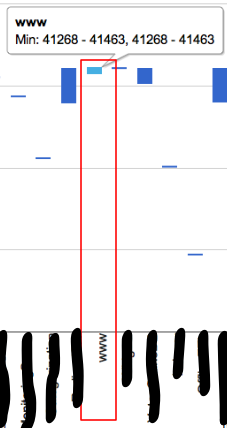
Let’s zoom in a bit:

What this diagram tells us is that the module www has versions starting from 41268 up to 41463 in production. This is normal as we don’t necessarily deploy everything to all servers at once, but this graph helps us easily find hosts that are left behind for too long, so for example if one of the modules had not been deployed in a while then you’d see it falling behind low on the graph. Similarly, if a module has a large variability in versions in production, chances are that you want to close that gap pretty soon. The following graph illustrates both cases:

To implement this graph I used a crippled version of the Candle Stick Chart, which is normally used for showing stock values; it’s not ideal for this use case but it’s the closest I could find.

That’s all, three charts is enough for now and there are other news regarding our evolving deployment system, but they are not as visual; if you have any questions or suggestions for other types of graphs that could be useful don’t be shy to comment or tweet.


The Three Axis of Software Management Complexity

The title sounds bombastic but hopefully the content is going to be trivial… For anyone who’s been doing software provisioning in a non trivial environment this post should only be calling names to things he may already know.

Yesterday I was chatting with Nati Shalom and we were analyzing the difficulties of maintaining software for non-trivial web services, backend services or anything along these lines. We got the the conclusion that the various difficulties could be categorized into three different categories and so we named them as The Vertical, The Horizontal and the Depth axis (for lack of better name, I’m still looking for a better name to replace Depth).

In most cases, installing a single backend service, a frontend service or any random software component really (doesn’t necessarily have to be a service) isn’t too hard. For example, think of installing a single instance of MySQL or Cassandra or Apache Tomcat. In most cases those things are not terribly hard to accomplish, there are usually some useful installation scripts and good tutorials. It sometimes may get a little more complex when the component installed depend on some other component but we’ll get to that later.

Things start to get complicated when you want to go one of the following directions: Install a full stack, not just a single service, for example a LAMP stack (although the LAMP case is a pretty common theme so there’s abundant information for it on the net, but in general where there’s a stack of different technologies that need to speak to each other it starts to get complex). We named the stack the Vertical Axis. When you need to create a cluster of the component, for example a cluster of mysql, a cluster of memcached etc. We called the cluster case the Horizontal Axis. Or when you really need to go in-depth of the process, for example, you need to analyze the performance of mysql on a single node. Let us elaborate on all three axis.

The Vertical Axis – building a stack

In most real world cases a service or a component is part of a larger stack. Some common software stacks I’ve worked with in the past include LAMP (Linux, Apach, MySQL, PHP), Linux-Apache-Tomcat-Postgesql, Linux-Tomcat-MySQL-Memcached, Rails-MySQL-Nginx, Jetty-grails-HSQLDB and of course those are the simple examples, usually it gets much more complicated as the service matures.

Installing or configuring or maintaining any of the given components isn’t terribly hard but usually when you need to get tomcat talking to MySQL or memcached or apache talk to tomcat, it starts to get just a little bit more complex. Of course this isn’t the end of the world, we’ve all been doing this for years, I’m just pointing out the extra level of work that needs to get done in order to build a stack. For example, apache when serving infront of tomcat will need to know which port tomcat listens to in order to forward the request to the correct port. An app running inside tomcal will need to know which port mysql is using and which port memcached is using and so on. If any of the components in the stack needs to get upgraded you’ll need to verify the correctness once again not only for the upgraded component, but for the entire stack as well.

So to sum up the vertical axis – think of a single host with a stack of services and a graph of dependencies between them, for example apache depends on tomcat which depends on mysql and memcached.

The Horizontal Axis – building a cluster

Now think of a single component, for example a mysql server which you want to multiply and make a cluster of. This is typycally known as Sharding. Now things start to get really complicated. Although many shops employ database sharding, it still remains difficult to execute, hard to maintain and has a number of limitations. Some databases such as cassandra, which I’m a big fan of, do make this job so much easier but they have other limitations and a learning curve.

A few more examples of what may be considered as a horizontal axis expantion and the challanges related to it are:

  • Scaling a memcached cloud from one instance to two. Or even from two to three or any N to N+1. Memcached is a simple cache server and has a simple protocol and part of this protocol means that the client needs to know which exact server holds the key it is looking for. So a client cannot simply connect to a member of the memcached cloud, ask it for a value and hope this member will figure out which other member of the cloud owns it. Memcached doesn’t work like this, memcached expects the clients to know which server holds which key. As a result, when adding a new host to the clusters (or removing a host), what usually happens is that clients need to re-hash their keys which may lead to a) more complexity at the app level in the clients or b) simply clearing all the cache a starting afresh (which is unacceptable in many cases)
  • Scaling a web frontend such as Tomcat from one instance to many. If your web app uses sessions managed by Tomcat or any kind of other local state then you’ll need to get that state synched up to all the members of the cluster. Tomcat does add support for this out of the box but it’s limited in scale. A different solution, or a solution that may be combined with that is taking care of session stickiness by a front facing proxy which isn’t trivial either and is also limited in scale. What people usually end up doing is instead of dealing with sessions, they give up on sessions and any kind of state management whatsoever in their frontends just so that when the day comes and they need to scale them horizontally, they will be able to do so easily. Heck, even google’s appengine has that as a design guideline – no state whatsoever, if you need anything then it’s in the persistence or caching layer.
To sum up the horizontal axis, think of a single service that you want to multiply in order to gain capacity (or failover or what have you).

The Depth Axis – really understanding what the service does…

The third axis is the Depth – really undersntanding what the process does, “how does the process feel”

Is your database overloaded? Is it close to being overloaded soon? If it’s slow then why is it slow? if it’s inconsistently slow, then why does it misbehave in certain conditions?…

Being the service doctor of even a single service on a single node, such as mysql, tomcat or cassandra could be a challanging task. It’s like watching the shadows on the wall and trying to figure out what creature’s creating those shadows. You’ll have to use your detective skills by monitoring the performance data of the service, monitoring possibly other services that operate on the host, of the file system, of the memory, fiddling with different parameters of the OS and of the service until you’ve finally nailed it.

All three axis – the vertical, horizontal and depth are each complex on its own. The reality is that in most real life scenarios you’d have all three of them at the same time.

The Time axis – software erosion.

And yet, there’s one more – the time axis. As surprising as this may sound, software erodes, not only rocks, software does so too.

If you’ve written a successful program, say a web site, you shouldn’t be surprised if after two years it suddenly stops working. There could be many reasons for that, for example, the log directory got full and logs weren’t being deleted from it, you used a 3rd party API which got changed, your OS gets old and vulnerabilities are found and spread while you did not take the time to patch it so you got hacked; or if you did patch it, then perhaps your program doesn’t work because of the new patch, really there are infinite number of reason why your software rots, decays, erodes, so today no one’s really surprised to find out that a two years old service is not functioning as it used to do when it was first launched if it hadn’t been taked care of.

So the time axis adds yet another complexity, even if your service is stagnant, you don’t gain more users and don’t care to add features and don’t bother to maintain it, there’s a good chance that it will eventually stop working because of rot.

That’s it, that was our observation that I wanted to share – these are the three plus one axis that make software maintenance, management and development a whole lot more complex in real life scenarios compared to the neon light lab scenario.


Creating a Minimum Viable Product start page with WordPress

Update: Cross posted here and at recipitor’s blog

This post is a how-to for launching a simple Minimum Viable Product (or even less) web page for a new product I’m working on. If you want to read the story go ahead, otherwise skip right to The Point.

The Story

When I started working on my latest venture, recipitor.com I wanted to start by creating a very simple site that explains what the intended, not yet existing, product wants to do and allow the interested users to leave their details so we’ll get back to them later.
At first I thought I’d use a Google-form which is quite handy for collecting details from users, simply create a form by defining its fields (name, email) and it collects the data entered by users to a google spreadsheet. I’m usually sold on google products (I’m biased) but after having tried a few different things I realized I was simple unable to create something that was not-completely-ugly. Maybe if I put some more work into that I could get something better but given my design skills, I would not hold my breath.

Then I realized that actually wordpress is quite good not only for blogs, but is also very good at creating very simple sites. All I wanted is just a landing page with a few paragraphs, maybe some graphics and a registration form. Details of the users would either go into a database or simply to my email address.

Luckily a friend pointed me at 7 WordPress Themes for Launching your Minimum Viable Product which is a great resource if that’s what you want to do – create a simple site, using wordpress that you can use to start marketing your product. Later I found even more themes on the MVP line, but from this list I chose the most basic (and free) theme, called Coming Soon by Templatic. The theme is very simple and what’s nice about it for hardcore developers like me with zero design skills is that it leaves very little room for design choices.

Here’s how the theme looks after adding my wording

The Coming Soon theme is a free one-page theme. All URLs on the blog simply land at this page. So it’s effective as an initial setup, but you’d probably kick it out once you have more content to show. Still, as a start page it’s quite nice.

What was missing from this page is a simple registration form.

We just wanted to collect contact details of users that may be interested in our product and so we wanted to place on this page a simple text box that collects email. Luckily wordpress is very rich with plugins and for the simple case of a registration form there are probably a dozen. I chose the popular Contact Form 7 plugin which has a rich set of features and its own (very simple) DSL to create registration forms and send the details by email. When a user signs up on the form an email is sent back to the address I created for that register@recipitor.com. You can see another example of the form as it’s used on this blog, see http://prettyprint.me/contact/

The Point

I installed both the Coming Soon theme and the Contact Form 7 plugin only to realize that they just can’t seem to work together! So I fixed it and hence the post.

The Contact Form plugin lets you edit the form with its UI which is pretty simple (it’s DSL is something like Name: [text name watermark "Your Name (optional)"]) and then when you’re done all you have to do it paste a snippet of the sorts [contact-form 404 "Not Found"] into your posts or a page or a widget and you’re done. That’s pretty simple. Only that the Coming Soon theme doesn’t play nice with it.

The theme has it’s own kind of interface for editing text. Instead of editing a real wordpress page it lets you edit its options page and that’s where you can add your text. It looks like this:

So the problem is that if you try to paste this [contact-form 404 "Not Found"] into the Product Description section you don’t get a form like you expected, you just get this text [contact-form 404 "Not Found"]… not great. I suppose the Contact Form plugin does some kind of preprocessing on the content of the posts or the pages or the text-widgets and then replaces things like [contact-form 404 "Not Found"] with real forms. But since the theme is acting differently then the plugin is unable to preprocess it. In other words, the Contact Form supports real blog posts, real pages or real text widgets. The Coming soon properties page wasn’t one of them.

So I figured, hey, why don’t I make a Text Widget and place the [contact-form 404 "Not Found"] inside that widget, that should work, right? Huh…

When clicking in the Widgets menu I got the following annoying error message No Sidebars Defined, The theme you are currently using isn’t widget-aware, meaning that it has no sidebars that you are able to change. For information on making your theme widget-aware, please follow these instructions.

Googling a bit made it clear that I need to somehow edit the code of the theme so that it becomes Sidebar Enabled and that I can place widgets on it.

I haven’t done wordpress or php in, like 5 years, and even when I did I wasn’t proficient, so the following instructions may sound pretty straight forward to you; it wasn’t for me… so I’m sharing.

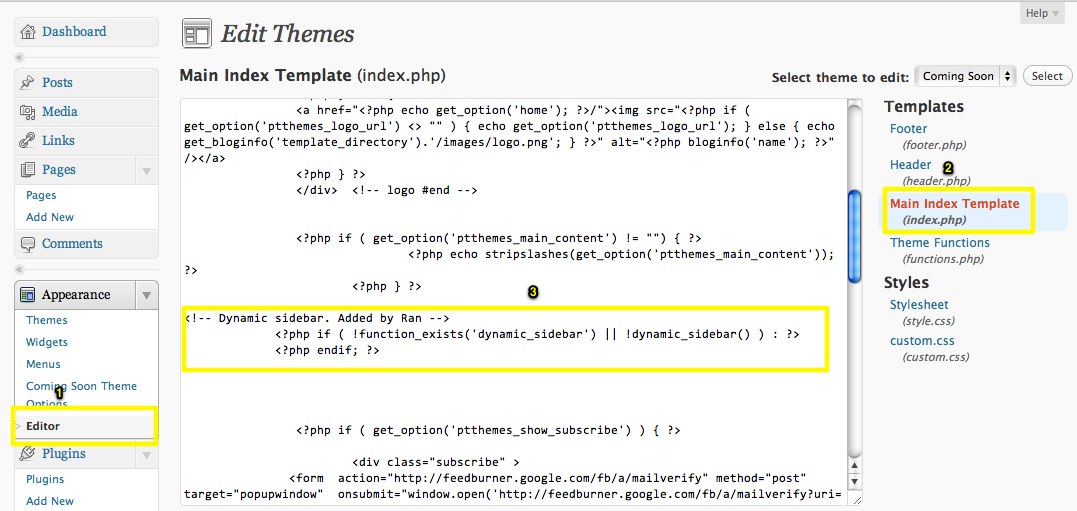
Edit the theme template to place the dynamic sidebar in it. The interesting code is: (screenshot below)

<?php if ( !function_exists('dynamic_sidebar') || !dynamic_sidebar() ) : ?>
<?php endif; ?>
Editing Coming Soon - index.php

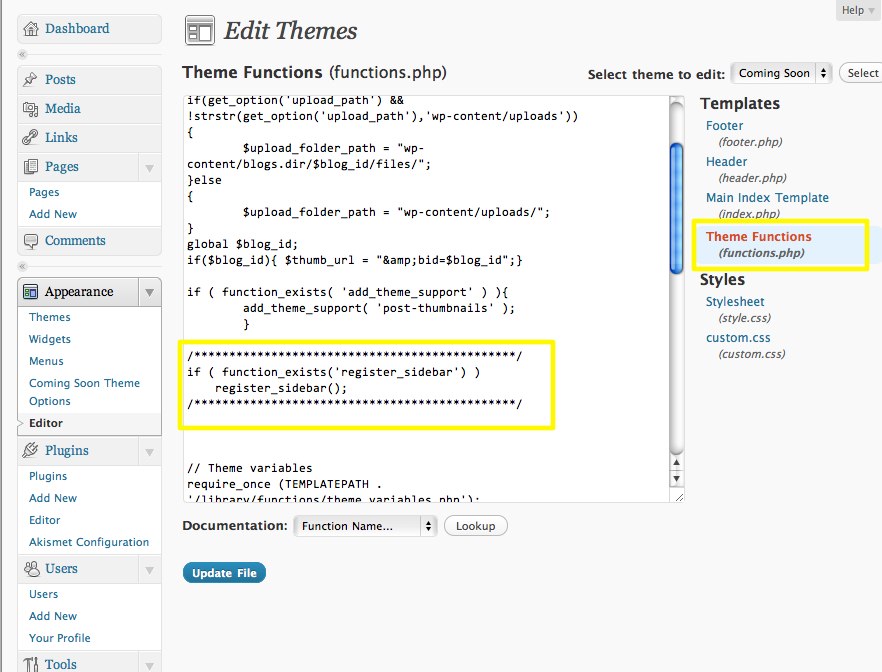
Then the next step is to add to functions.php the following code: (screenshot below)

if ( function_exists('register_sidebar') ) register_sidebar();
Editing Coming Soon - functions.php
Editing Coming Soon – functions.php

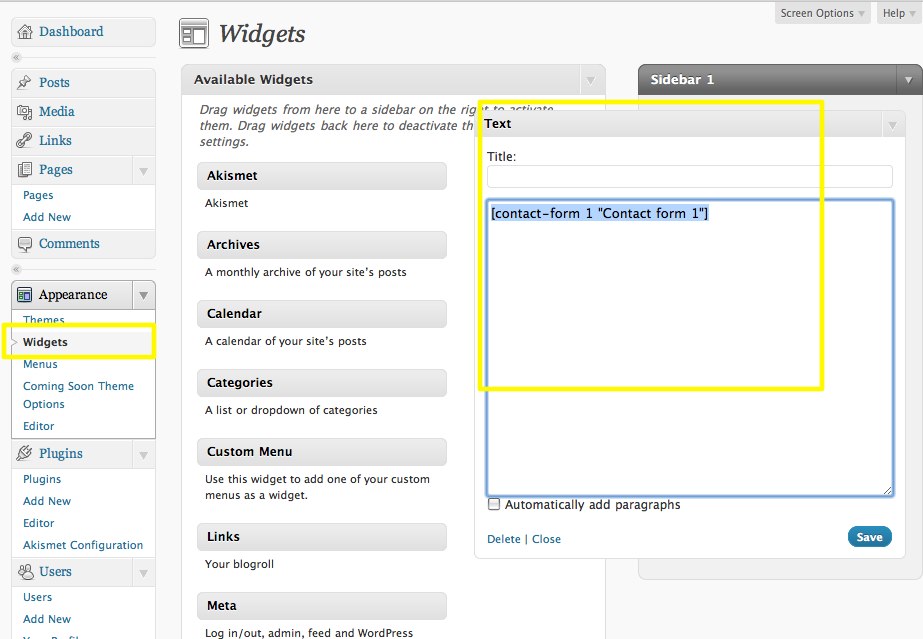
From here it’s pretty straight forward. Now you can go back to the Widgets section, add a text widget and in this widget paste the forms code. [contact-form 404 "Not Found"].

Text widget with a contact form

The final result was quite nice. Here’s the single-page blog/site with the registration form: (currently at recipitor.com)


Continuous Deployment at outbrain

Warning: very long but interesting write-up ;)

It gives me great pleasure that the last project I’ve been working on at outbrain is one with the potential to speed up product development and is at the frontline of many web companies: Continuous Deployment. These are my last days at outbrain (I’ll share more about where I’m headed later) and I feel this is the right time to share my learnings about CD.

Background

For the past few months I’ve been hard at work on continuous deployment at outbrain. Initial inception of this project started about a year and a half ago when I was starting to get the feel that “things are moving just too slow”. Maybe for desktop or other kind of apps a slow dev process is right, but since Outbrain is a web service, it just felt it didn’t need to be this way (and recently, Google’s Chrome team have made their release process public which shows that even for desktop apps it can be faster).

What doesn’t need to be this way? What am I talking about? – I would implement a feature, write complete unit tests, all went well but then I had to wait. I had to wait for the next release cycle which was usually a few weeks ahead. During this release cycle, QA would go through my new feature or bug fix and sometimes would reject it or just have a different take on my solution. Then, when my head is several weeks older and completely drained elsewhere, I would have to stop the world, fix what needs to be fixed and return to QA, then, if all went well, it would usually take another week or two until the feature is fully public to users, and this is where real feedback starts to show, then I may realize that I’ve spent 90% of my time on things that don’t matter. I would constantly switch context between projects and features due to this few-weeks gap between feature development and feature-meets-the-users. Context switches are expensive, even for humans.
Outbrain is not the only company struggling with this. As a matter of fact, at the time, outbrain was one of the luckiest to employ only a few-weeks release cycle, while others employ months, sometimes even a year. Yes, even internet companies, large internet companies, would stall for a whole year before releasing something, been there…

It was about a year and a half ago that I was starting to poke my manager, hey, why do *I* need to wait in line like the rest of my team? I trust my code, it’s ready! Does it really make sense for my new cool feature to be bundled with other cool features just because we decided to roll on release cycles? Those features have nothing else to do with each other except for the fact that they were decided to be worked on by two different individuals but roughly at the same timeframe. And worse, why do I need to wait and sync with other features, even if they delay, why do I need to delay my own features which are, again, completely unrelated and don’t depend on them, just because other features are more heavyweights? And why do I need to rush my heavyweight  feature even when it’s not yet ready, just to make it on time for a release cycle so that other folks are not delayed? And why do we have to fear the “release-day” and eat pizzas for a few days-nights? Releases should be fun, not a nightmare. And as Kent Beck has put it, “It’s easy to mistakenly spill a bucket, we should use a hose of features, not carry buckets of them” (my wording, his idea).

Those kind of thoughts were circling not only my head, and not only outbrain. As a matter of fact, outbrain is a bit (very) late on the continuous deployment train and we’ve had other companies we were lucky to be learning from. Companies such as WealthFront with my friend Eishay, flickr, etsy and others have successfully implemented their own take on continuous deployment aligned with devops, which is a different concept but in my mind related. At the beginning, to me it was clear that something is wrong at how we do things, but getting everyone aboard the mission to fix “it” was about a year of work… It’s not that I had the full solution right up front, admittedly, for the past year I’ve been experimenting with different ad-hoc solutions, plus, our company, like any other company, had to invest not only in engineering best practices but also in, well… in its business, so frankly most of the time I was hard at work doing the business and not doing infrastructure. But at some point, after heaving read some inspirational posts from other companies, after having met with a few developers from those companies, it was decided, outbrain is on board for continuous deployment and I was happy to be one of the core drivers of both the decision and the implementation.

Looking back at where we were a year ago (this doesn’t have to take a year, by the way, I was doing many other things at the same time), I would never want to go back there. Slow and lengthy release cycles, sleepless nights at the point of release, unpredictable release dates and delays beyond your control, all these were not doing good to the good but potentially fragile relationship between product, dev and ops. Add to that a fast growing business with daily firefighting, engineering challenges of ever-growing scale and business direction that isn’t always clear to a company this age. However, even given all this pain, at that time it wasn’t always easy to get everyone on board at investing a few months of man hour, completely changing our engineering, QA and operations culture, and doing something that only a few companies in the world had succeeded in, and it was not yet clear that *we* are going to succeed in. As a matter of fact, even today, even though most folks are on board, there’s still work to do (AKA culture)

When it finally happened, and a formal decision to “go for it” was imminent, a few of us were already “doing it”.  Doing it meant, first write a whole lot of tests, which is obviously a good practice, regardless of continuous deployment, but is absolutely necessary for a successful continuous deployment scheme, releasing new features or bug fixes right out of trunk, even though the rest of the team was still working in release branches, some of us have just decided that this is silly and we’re not going to play game, and some limited deployment automation and live systems validation (“testing production” rather then testing a staging or test environment). There was still a long way to go but the cultural shift had already begun and and culture is one of the corner stones.

It’s funny, it seems like with Continuous Deployment, we’re all getting back to high-school again; a few are “doing it”, some even perform well, some only say that they’re doing it but they really aren’t and those who don’t do it, never mention this unless they get asked.

The Goal

The goal was to make deployments easy and safe so that new dev-to-user-feedback loop is as small as possible.

We want to be able to move the product fast, so we don’t want to spend all day monitoring ongoing deployments or triggering them, we want to spend the time writing features, not fighting fires so we need a robust system that we can depend on. To refine this we’ve put ourselves to the following list of goals from the continuous deployment system:

  1. Easy. One button to rule them all, or one simple commit, or one simple script that you have to fire and forget.
  2. Safe. Things would fail, all the time, that’s expected. Sometimes it’s your fault but many times it’s just the hardware or someone else’s fault, but either way, you have to deal with it. The goal was for the system to be safe which means that it does everything that’s in its power to validate that the system is stable, if need be, rollback to a previous version, and alert the heck out of everyone when/if something went wrong.
  3. Automated, as much as possible. Automate DB schemas update, automate monitoring, automate service upgrades, automate infrastructure, automate all. This is a derivative of the first two but worth mentioning.
  4. Be able to deploy any outbrain service to any subset of servers (choose by staging, all, one DC, two, 50% etc).

The Tech

With the current system that we’ve built a developer is able to commit code and soon thereafter his new code is deployed to all production servers and meets users. The developer can choose whether she wants to release to a restricted set of staging servers or to the complete set of all servers. Everything is completely automated, a simple $ svn ci command would start things off and there you go, a few minutes later (sometimes an hour later), depends on the speed of the moving parts, but with absolutely zero manual intervension, the new service is fully deployed to the eyes of the users.

We are still far from the dream-solution we want to have in place, however, I think what we have acomplished so far already enables us iterate significantly faster on the product.

The Core Components

The core components, as we’ve so far determined, are part cultural, part technical, e.g. tools. Some ppl ask me what’s more important, culture or the tools and I say (and I didn’t make this up) that culture is more important but tools help make the right culture. For example, if you look at code reviews (we use reviewboard, BTW) then just saying Code reviews are great or Code reviews are obligatory isn’t going to help when you don’t have the supporting tools to make code review fun.

The core components are:

Trunk Stable

When I was at youtube I was told that everything I commit to trunk may, at any time, possibly 5min later, go live to a few hundreds of millions users. Imagine that. At the time youtube was not employing continuous deployment per-se but the culture was there. Every developer knew that every commit to trunk counts and may be seen by users at any given time, even after the committer has left the office. Usually code pushes went out once a week but there were emergency pushes almost daily. At first a few skepticals thought that this might slow things down, that everyone would be terrified to commit code, but as it turned out, quite the opposite happened, things just moved faster as folks would still commit code regularly to trunk (and with care, as they should) but they did not have to burn so much time on backporting or forward porting to branches, if you’ve ever used subversion for that then you know what I mean. (of course git makes merges a hell of a lot easier)

At outbrain we’ve decided to go trunk-only a few months ago. This, together with a well established automated testing culture and with live service validation is one of the main cultural pillars of CD.

Trunk stable means a few things:

  1. As the name suggests, trunk should always be stable and ready for production. Needless to say, never commit a code that does not compile, never commit a code that fails automated testing, never commit something you don’t want users to see. Keep in mind that sometimes even if it’s not you releasing your service, someone else might.
  2. Everyone works on trunk. There are no release branches (tags are OK), no need to merge code, no need to commit twice.
  3. Commit often, commit small. Never keep your edits more than one day, preferably no more than one hour, always commit them as soon as they are ready. Commits should be as small as possible, the smallest atomic unit (that compiles, passes tests and does not intimidate users).
  4. Use feature flags. If you have code that’s not ready to see users yet (this sometimes happen although we try to set that to a minimum), then use feature flags to hide your code. A flag can be passed over from a user (internal user) in the URL for example &enableFeatureX=true or set on a service properties file in a staging environment for example. The idea is to use as little as possible feature flags b/c conceptually they are like branches and they make things complicated. As soon as the feature is fully released, remove the flag from the entire source tree to clean up the code.

Trunk stable is something many companies do and is not special to continuous deployment neither to outbrain. But this is IMO one of the required steps and a big cultural change towards CD.

Automated Testing

This is the second, but actually the most important pillar. Automated testing and testing infrastructure are at the heart of every software organization that respects the profession and far better experts have produced extensive writeups on the subject, so I will refrain from delving into any details here. I will just very shortly describe the motivation and how we use automated testing.

For one, if you release something every 5, 10, 15 or 60 minutes, even once a day, you cannot afford to have someone-in-the-middle, any kind of manual process is unacceptable and will just kill speed of the process. Some things cannot be automoatically tested, for example if you add a new feature you should do your usability homework, but that aside, 99% of the features, bug fixes and code can and should be completely automatically tested. I’m saying that heavy hearted b/c admittedly at outbrain we do not excel in it. Our tests do not have sufficient coverage nor are they sufficiently reliable (some tests “randomly” fail, or even worse, “randomly” pass). However, we’ve decided to embark the CD train nevertheless and fix this technical debt as we go.

Tests need to be fast. If you release every couple of weeks then it doesn’t hurt anyone that the entire test suite takes 1h to run. If you deploy a few times a day you’ll be losing your patience and your deployment queue would get overloaded. A few minutes (we are down to 5) would be a reasonable time for a good test cycle.

Monitoring, self-test and service instrumentation

We deploy fast, it’s easy and we deploy many times a day, but we do not deploy recklessly. We want to make sure that during/after deployments the system is stable and it stays stable. We did not make this up, most of the things I’ve learned again from my friend Eishay at WealthFront.

We instrument the services such that a service call say “I’m OK”. we have a version page which lists all versions of the service’s libraries, a selftest page which, when invoked runs a list of internal tests (talk to a DB, talk to another service etc) and returns a success status. We need to add a perf page that tells us how’s the performance looking at the server right now and more instrumentation is welcome.

The deployment tool, right after deploying the new version would check the service’s selftest page and will continue to the next server in the cluster only if that test passes. We do not have automated rollbacks yet, but this is planned.

Infrastructure Automation with Chef

When we set out to do CD there was a preliminary step we had to take – infrastructure automation. Infrastructure automation is one of the things that will make your ops guys really happy (well, if done right…). Outbrain is probably the last on the train of infrastructure automation, indeed we were very late to that, but finally we’re here. I wouldn’t say it’s completely required for CD per-se but I would argue that it’s completely required for any web shop that manages a non-trivial set of services and those shops happen to be the ones that also look at CD, so the correlation is pretty high. Plus there’s another thing, clulture is here again, if you want your team thinking about constant deployments and always being ready to go live (and actually doing it), you better have your ops team aligned to that as well. Infrastructure automation makes this message clear, in one commit or one button push you have an entire datacenter ready for operatration.

We’ve looked at a few tools and finally chose Chef. I think Puppet isn’t bad either but we never gave it a serious try.

I must say that at the beginnig, choosing the tool for infrastructure automation was something that we (and I personally) put a lot of time into, it was a time sink. I was looking for a tool that would do everything, that would automate both infrastructure and application deployments. For example, a tool that would install tomcat and would also install it’s webapps while at the same time configure its monitoring on opennms (we’re moving to nagios now). Now, there are some tools that do it, as a matter of fact, most tools that I’ve seen could do it all, one way or the other, that’s why it was so confusing b/c they all could do it, but each one had its own nuance and preferences and some were better at infrastructure automation, others were better at application-level deployments and I was looking for the perfect tool that does both. I’ve looked at Chef, cfengine, puppet, ControlTier (horrible, sorry), and a few others. Finally I’ve decided that I’m going to use two different tools, Chef for infrastructure and Glu for applications.

Deployments with Glu

Glu is a young tool, not for the faint of heart. Glu was developed at linkedin and was outsources just a few weeks ago. I think outbrain is the first “customer” outside of linkedin, that is to judge by the relative number of my posts on the support forum…

Glu is a deployment tool, conceptually it works somewhat similar to chef or puppet but to me it seemed more convenient as a product deployment tool. With glu and its nice API it’s easy to create a (json) model that describes your deployment scheme, create an execution plan to update the servers and execute it either in parallel or in sequence. With its API it’s also possible to create even more complex deployment scenarios such as Exponential or any other that you like.

The following diagram, taken from glu’s overview page describes its core architecture.
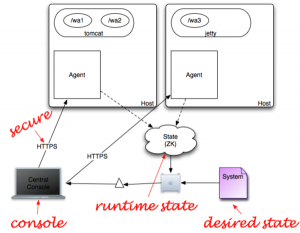
Glu requires an agent to be deployed on all of the target hosts and a web console. The agents report their status to a zookeeper and the console gets its input both from ZK and from the user/API. The console then lets you Define a Model which tells it which service is deployed where and then execute an update which will install or upgrade the service according to the reports generated by its agents and saved into ZK.

We use both glu’s API for automated deployments and its web console to monitor its progress or to perform ad-hoc deployments. More on that in the next section.

Servicisation – Componentization

One of the core principles in software development (and math, and chemistry, and…) is breaking a problem to smaller parts to solve it. No news here, so why do I bother mentioning that?

When you release often you want to make sure that:

  1. If you caused a damage, the damage is contained, it’s the smallest damage possible
  2. If there is an error it’s easy to find where it is and what caused it. Smaller services and smaller releases make that an easier problem.
  3. If you need a rollback, it’s easy to do so. The smaller the roll-forward the easier the rollback is.
  4. There’s always more than one instance of any type of services so that when you take one down the system is still functioning.

Breaking your services to small parts makes CD much easier.

The Deployment Pipeline

In this section I’ll describe the system we’ve built. We don’t think this is the best of breed and we have like 20 other features or shortcomings we have on our todo list but I thought it’d still be helpful to read how it works.

What I describe here is just product deployments, not infrastructure automation. Simply, you write your code, test it, then you want users to see it. The assumption is that all databases are already in place, configuration is in place, application servers are in place, all you need to do is deploy new bits.
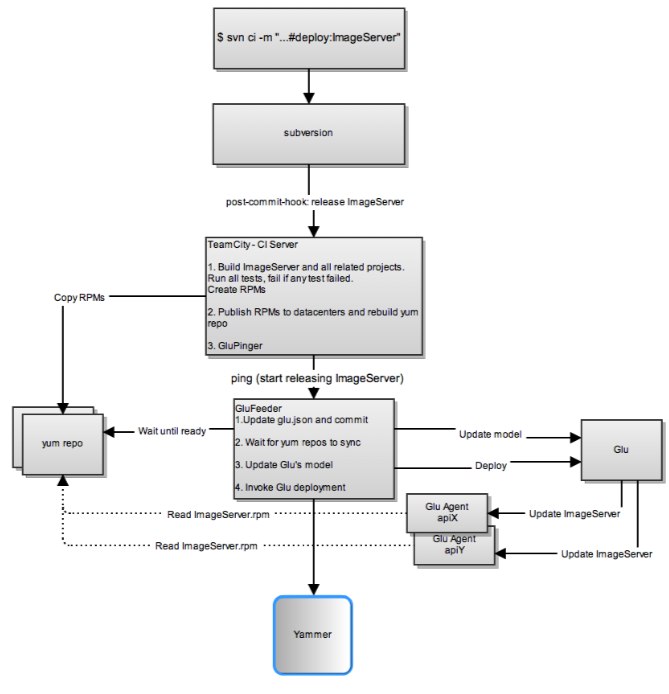
Here’s an explanation of the flow:

  1. A developer edits some source files, completes a feature or a bug fix, writes tests and commit with the message “Fixing bug x #deploy:MyService #to:staging
    1. The #deploy has the module name to deploy. It may contain a list of modules, such as #deploy:ImageServer,RecommendationEngine
    2. The #to describes a set of tags for the services to be deployed. For example: #to:staging (staging environment) or #to:my_host (just one host, every hosts are tagged with their host name) or #to:ny,asia (deploy to both the NY datacenter and asia datacenter)
  2. When the commit is done a subversion post-commit hook is run and extracts the #to and #deploy parameters from the commit. It discards all commits that don’t have #deploy and those that do have #deploy are sent to the CI server
  3. The CI server (we use TeamCity, nice UI but a miserable API) builds the module and all modules it depends on (we use maven so dependency management is a breeze) and creates RPMs. RPMs are RedHat/CentOS/Fedora’s standard packages. RPMs are nice since they let you easily query the host, once its installed for the current version and with the help of yum they make version control easy. When the build passes including all the tests:
    1. The RPMs are copied to the yum repositories and
    2. The repositories are asked to rebuild their index.
    3. Then, the last step of the build pings GluFeeder telling it to release the module and sending the #to tags.
  4. GluFeeder is the middleman between Glu and outbrain’s system. Glu requires a model file which describes each service and its version. After a #deploy a specific module on specific hosts that matches a certain tag needs to get its version updated. GluFeeder does that, it reads glu’s model file from subversion where we keep it and updates just the parts that need to be updated. GluFeeder follows these steps:
    1. Read glu.json model file from subversion, select the nodes that match the modules being #deployed and that match the #to tags selection and updates their version
    2. Commit the file back to subversion
    3. Wait for yum to be ready. Sometimes it takes yum a little while before the RPMs are fully indexed, so GluFeeder would wait that and poll every 30 seconds. A related project is yummer
    4. POST the model file to Glu
    5. Tell glu to update all the new modules that were just posted.
    6. Post an update to yammer to let everyone know that a release is in process
  5. Glu now takes command and starts a sequential release to all the nodes that need to be updated. This is the last step in the process and if it was successful the release is done.
    1. Glu’s agents install the new RPMs which in most cases contain a WAR file and restart the tomcat web server.
    2. They then wait for tomcat to be ready (polling) and check the new app’s version page to make sure that it was property deployed and that the context was brought up
    3. They then access the self-test URL to make sure that the service is well functioning.
    4. When all tests passed an agent is done so it tells the glu console that it’s finished successfully and the console continues to the next. If one of the tests would fail, the deployment immediately stops.
    5. An agent would also set a timer to test the self-test every 5 minutes from now on so that we know that the service is still alive.

The first thing to note is that We Are Not Done. As a matter of fact, outbrain has just started. The current system is still pretty much barebones and there are numerous improvements and plenty of love it still deserves. Like any web product, this product is not done and will probably be never done, unless it’s dead… However, it does give us a pretty good start since now there’s a framework, the basic features are there and the deployments are already *so much easier*.

This whole process takes a variable amount of time, something between 10 minutes to 1 hour. The reason for most of the delays is the size of the RPM files and their transfer time. They are about 70M, and their size is mostly influenced by the large number of 3rd party jar files embedded in the WAR. This doesn’t have to be this way and we need to fix it. There are a few possible fixes and we will probably use a combination of all of them, one is just remove all the unneeded dependencies, another is better componentization. But by far the most effective way is to copy only what we need to copy, do not include all the 3rd party or even outbrain’s own jars if they haven’t changed. This is possible and can be embedded in the RPM script,  but it’s out of scope for this writeup.

Another place for improvement is the build time and quality. Our tests run much too long, they don’t have enough coverage and they sometimes fail “randomly”, e.g. depending on some external unclean state such as a database. As a matter of fact the mere fact that they actually use a database is a pain, not to mention that it causes slowness and severely degrades reliability. There’s much work to do on the testing front.

We would like glu to tell us if/when something went wrong with a deployment. We want bells to ring and alarms to go off. Currently to the best of my knowledge there is a way to do this through glu’s (nice) API, we just didn’t do it yet. It’d also be nice if glu supported something like that out of the box. (feature request was posted)

What we did not implement yet is a service publishing mechanism whereby a service, when it goes down would unpublish itself  by telling its users (other internal services) that it’s going down and then republish itself when going back up. Currently we use a load balancer for that (HAProxy) which sort of makes this work. The proxy would know that if a certain box gives too many errors it needs to go out of the pool but the downside of that is that, first, there will be errors and you’d get dirty logs and perhaps some suffering users b/c at least the first request would be erroneous and second, it takes some time for the proxy to take action. This can be improved by synchronous  service publishing whereby a service announces itself as up/down in a shared storage such as zookeeper (and of course that’s not the only way).

Reliability wise we can do a lot more. We use the self-test hook which is a good start but there’s so much more that can be done. For example, since we already have a client on each host then it’s relatively easy to monitor the logs and search for ERRORs of Exceptions. Another thing we ought to do is monitor the KPIs (Key Performance Indicators) in an automated way so that we know that if a certain release has degraded the quality of our serving then we need to roll it back. and figure out a fix for that.

Automated rollbacks is also something we did not do yet. Glu does not support this out of the box (feature request submitted), but it can be done with its API. Currently, to roll back a release takes a few mouse clicks so it’s not that hard which is a good thing but it would even be nicer if a complete and atomic plan existed in glu such that if a release breaks in the middle then an automated rollback is employed.

Overall, even with all the points we’ve written down for improvement, we’re very happy with the system as it is right now since streamlines the deployment process, saves a lot of developer time and makes it much more robust than it used to be.

Hector API v2

Update: This post is now close for comments. If you have any questions please feel free to subscribe and ask at hector-users@googlegroups.com

Update: The API was change a bit, it was mainly package renaming and interface extractions. To get a consistent snapshot of the api usage have a look at github on the release tag for example for 0.6.*:
http://github.com/rantav/hector/blob/0.6.0-17/src/main/java/me/prettyprint/cassandra/examples/ExampleDaoV2.java
and http://github.com/rantav/hector/blob/0.6.0-17/src/test/java/me/prettyprint/hector/api/ApiV2SystemTest.java

and for 0.7.*
http://github.com/rantav/hector/blob/0.7.0-18/src/main/java/me/prettyprint/cassandra/examples/ExampleDaoV2.java
and http://github.com/rantav/hector/blob/0.7.0-18/src/test/java/me/prettyprint/hector/api/ApiV2SystemTest.java

Hector is a high level java client for the cassandra database. It was first released some six months ago and was coined  as the de-facto java client for cassandra.

There is a large community of users and companies who run their production high scale systems based on hector.

The main benefits hector adds to the existing thrift based interface are:

Since the time hector was first written, first by me, then with the good help of other community members (of note is Nathan McCall) it’s gained popularity even in the face of “competition” so to speak, in an open source manner.

However, one thing that I’ve always felt we can improve is the API. When writing the first version of hector the premise was that users are comfortable with the current level of the thrift API so hector should maintain an API similar in spirit. Hector may make things more type safe (such as when replacing all the ColumnOrSuperColumn types with specific Column or a SuperColumn typed methods) but in general I figured I should introduce as little new concepts as possible so that new users who are already familiar with the thrift way can easily learn the new library.

I was wrong.

As it turns out, users don’t learn the thrift API and then go use hector. Most users tend to just skip the thrift API and start with hector. Fait enough. But then I’m asked why did I make such a funny API… They are right, users of hector should not suffer from the limitations of the thrift API.

Add to that the complexity of dealing with failover, which clients need not care about at the API level (and in the v1 API they did) and some complex anonymous classes and the Command pattern users need to understand (if only we could have closures in java…) then we get a less than ideal API.

So the conclusion was clear: an API v2 was needed.

The new API uses the same proven hector implementation underneath but exposes a cleaner interface to the users. It also makes meta operations such as cluster management explicit.

We’re all coders, so enough talkin, let’s see some code…

// Create a cluster
Cluster c = HFactory.getOrCreateCluster("MyCluster", "cassandra1:9160");
// Choose a keyspace
KeyspaceOperator ko = HFactory.createKeyspaceOperator("Keyspace1", c);
// create an string extractor. I'll explain that later
StringExtractor se = StringExtractor.get();
// insert value
Mutator m = HFactory.createMutator(keyspaceOperator);
m.insert("key1", "ColumnFamily1", createColumn("column1", "value1", se, se));
 
// Now read a value
// Create a query
ColumnQuery q = HFactory.createColumnQuery(keyspaceOperator, se, se);
// set key, name, cf and execute
Result&gt; r = q.setKey("key1").
        setName("column1").
        setColumnFamily("ColumnFamily1").
        execute();
// read value from the result
HColumn c = r.get();
String value =  c.getValue();
System.out.println(value);

Clusters are identified by their name, in this case MyCluster. A call to getOrCreateCluster(“MyCluster”, hostport) would create a new cluster if it doesn’t exist, but return a previously created one if it does. The Cluster object represents the client’s view of the cassandra cluster. A program may hold several Cluster instances, although typically one is sufficient.

A KeyspaceOperator is the object used to make operations (reads, writes) on specific keyspaces. A program can create many of those.

The StringExtractor is interesting… Hector provides type safety for column names and column values. Recall that in cassandra column names are byte[] and column values are byte[] too. So usually the programmer is required to translate those bytes back and forth to actual java objects. When designing the API we wanted to simplify this work and provide a type-safe API. Note that in the next lines we use HColumn<String, String> which is a column who’s name is of type String and value is also of type String as well as ColumnQuery<String, String> which is a query that returns columns with String names and String values. We could also have chosen to have columns with String names but Long values HColumn<String,Long> where it makes sense for the application.

To provide this type safety hector defines an Extractor<T> interface.

/**
 * Extracts a type T from the given bytes, or vice a versa.
 *
 * In cassandra column names and column values (and starting with 0.7.0 row keys) are all byte[].
 * To allow type safe conversion in java and keep all conversion code in one place we define the
 * Extractor interface.
 * Implementors of the interface define type conversion according to their domains. A predefined
 * set of common extractors can be found in the extractors package, for example
 * {@link StringExtractor}.
 *
 * @author Ran Tavory
 *
 * @param   The type to which data extraction should work.
 */
public interface Extractor {
 
  /**
   * Extract bytes from the obj of type T
   * @param obj
   * @return
   */
  public byte[] toBytes(T obj);
 
  /**
   * Extract an object of type T from the bytes.
   * @param bytes
   * @return
   */
  public T fromBytes(byte[] bytes);
}

Hector provides a set of default and commonly used implementations of extractors, such as StringExtractor and LongExtractor (see package me.prettyprint.cassandra.extractors). Users of Hector are expected to implement their own application-specific extractors. The interface is pretty straight forward and simple, you only need to implement two methods which convert your type to/from byte[]. Extractors are purely functional which means that they don’t have side effects and have no state. Using extractors, the API adds simplicity, separation of concerns and type safety.

Next we create a mutator and insert a value:

Mutator m = HFactory.createMutator(keyspaceOperator);
m.insert("key1", "ColumnFamily1",
    HFactory.createColumn("column1", "value1", se, se));

The class HFactory (“Hector Factory”) has a set of many useful static factory methods. I usually just import static me.prettyprint.cassandra.model.HFactory.* and get all it’s public method as short method names, so the previous line can be written as:

Mutator m = createMutator(keyspaceOperator);
m.insert("key1", "ColumnFamily1", createColumn("column1", "value1", se, se));

Note again the use of the StringExtractor (se) when creating a column. The column gets a String name and a String value so it needs a StringExtractor to assist it in serializing and desiaralizing the strings to byte[]. As a matter of fact, we’ve noticed that it’s so common for use to use columns of type HColumn<String,String> that we decided we add a utility factory method: createStringColumn(name, value) which is a bit shorter than createColumn(name, value, nameExtractor,  valueExtractor). You may create your convenience factories as well and are welcome to contribute them back to hector.

Next to reading the value. We’d like to read a simple column value given by its key (key1), and column name (column1).

We create a ColumnQuery<N,V> where N is the type of the column name and V is the type of the column value (in this case, again it’s String, String)

ColumnQuery q = createColumnQuery(keyspaceOperator, se, se);

Next we set the query attributes – key, column and column family, and execute it.

q.setKey("key1");
setName("column1");
setColumnFamily("ColumnFamily1");
Result&gt; r = execute();

The 4 lines above can also be written shortly as a one liner due to method chaining.

Result&gt; r = q.setKey("key1").
        setName("column1").
        setColumnFamily("ColumnFamily1").
        execute();

What we see here is another feature of the API called method chaining. By convention all setters return a pointer to this so that it’s easy to setX(x).setY(y).setZ(z).
You can even call execute() on the same line, e.g. Result<T> r = q.setX(x).setY(y).execute().

execute() returns a typed Result<T> object. Note again the type safety. In this case we have Result<HColumn<String, String>> since the query is of type ColumnQuery<String, String>. In general we have ColumnQuery<N, V>.execute() => Result<HColumn<N, V>>

So far we’ve looked at the ColumnQuery<N,V> but as a matter of fact there an many other types of Queries, in this example we query a simple column but the API defines all types of query use cases allowed by the thrift API, all implement the Query<T> interface:

/**
 * The Query interface defines the common parts of all hector queries, such as {@link ColumnQuery}.
 *
 * The common usage pattern is to create a query, set the required query attributes and invoke
 * {@link Query#execute()} such as in the following example:
 *
 * Note that all query mutators, such as setName or setColumnFamily always return the Query object
 * so it's easy to write strings such as <code>q.setKey(x).setName(y).setColumnFamily(z).execute();</code>
 *
 * @author Ran Tavory
 *
 * @param  Result type. For example HColumn or HSuperColumn
 */
public interface Query {
  <q>&gt; Q setColumnFamily(String cf);
  Result execute();
}</q>

There are ColumnQuery<N,V>, SuperColumnQuery<SN,N,V>, SliceQuery<N,V>, SuperSliceQuery<SN,N,V>, SubSliceQuery<SN,N,V>, RangeSlicesQuery<N,V> and more… All query objects are type safe, so they return the only type the should return and the compiler keeps you safe.

To read the value off of a result object just call Result.get(). Here again we provide type safety so in this case the result is of type HColumn<String,String>

// read value from the result
HColumn c = r.get();

A Result , apart from holding the actual value also has some nice metadata, such as getExecutionTimeMicro() and getQuery(). We plan to add more to that.

Lastly we print out the string.

String value =  c.getValue();
System.out.println(value);

In this case value is of type String. If the column would have been defined as follows: HColumn<String, Long> then we’d have

Long value = c.getValue().

The new API has other nice additions such as an improved exception hierarchy (all exceptions extend HectorException which is a RuntimeException and there’s a translation b/w the thrift exception and the hector ones, see ExceptionTranslator), no dependency on thrift and more.

It’s important to note that the new API does not rely on thrift anymore, so users who want to use avro as their transport are able to do it without changing their implementation (after cassandra really supports avro, and we add that to hector).

Support for cassandra 0.7.0 is underway, and with the new API should be relatively easy to add.

An extensive list of tests of the entire query/mutate API is available at ApiV2SystemTest

To sum up, here’s a short list of new concepts introcuded by the v2 API and its main benefits

  • All previous functionality provided by hector remains. You still get connection pooling, JMX etc. The old API is still in place, untouched (except for some small exception hierarchy refinements) so if you have existing code already working with hector it won’t break. We do plan to phase out the older API just so we have only one concise API , but as of now it’s left untouched.
  • Clear and simple Mutator API calls. Mutator.insert(), Mutator.delete(), and for batch operations: Mutator.addInsertion().addInsertion().addDeletion().execute()
  • Extensive, yet very simple query support. The API supports all types of queries supported by cassandra as a simple and type-safe java API. You can query for columns, super-columns, sub-columns (subcolumns of supercolumn), ranges, slices, multigets etc.
  • Simple and concise exception hierarchy based on HectorException which extends a RuntimeException, so you don’t need to get your code dirty with try-catch where you don’t necessarily want to. You can still of course handle all exception types, the information is not lost, but code is much much cleaner when you don’t care to.
  • No dependency on thrift (or on avro). The v2 API is completely independent of the wire protocol. When avro is finally implemented by cassandra all you have to do is tell hector whether you want to use thrift/avro and that’s all, no other code changes. Hector provides its own (type safe) objects such as HColumn<N,V> or HSuperColumn<SN,N,V>
  • Type safety and separation of concerns. You implement (or reuse) a typed Extractor<T> and need not care about those byte[]s anymore.

Lastly, we marked the new API as “beta” not because it’s not ready, but purely because we want to get your feedback. We’d like to leave it as beta for a few more weeks to get the developers feedback and if everyone’s happy release it as final, so do feel free to let us know how you feel about it.
The API is available on the downloads page and is marked as 0.6.0-15.


Understanding Cassandra Code Base

Lately I’ve been adding some random small features to cassandra so I took the time to have a closer look at the internal design of the system.
While with some features added, such as an embedded service, I could have certainly get away without good understanding of the codebase and design, others, such as the truncate feature require good understanding of the various algorithms used, such as how writes are performed, how reads are performed, how values are deleted (hint: they are not…) etc.

The codebase, although isn’t very large, about 91136 lines, is quite dense and packed with algorithmic sauce, so simply reading through it just didn’t cut it for me. (I used the following kong-fu to count: $ cassandra/trunk $ find * -name *.java -type f -exec cat {} \;|wc -l)

I’m writing this post in hope it’d help others get up to speed. I’m not going to cover the basics, such as what is cassandra, how to deploy, how to checkout code, how to build, how to download thrift etc. I’m also not going to cover the real algorithmic complicated parts, such as how merkle trees are used by the ae-service, how bloom filters are used in different parts of cassandra (and what are they), how gossip is used etc. I don’t think I’m the right person to explain all this, plus there are already bits of those in the cassandra developer wiki. What I am going to write about is what was the path that I took in order to learn cassandra and what I’ve learned along the way. I haven’t found all that stuff documented somewhere else (perhaps I’ll contribute it back to the wiki when I’m done) so I think I’d be very helpful to have it next time I dive into a new codebase.

Lastly, a disclaimer: The views expressed here are simply my personal understanding of how the system works, they are both incomplete and inaccurate, so be warned. Keep in mind that I’m only learning and still sort of new to cassandra. Please also keep in mind that cassandra is a moving target and keeps changing so rapidly that any given snapshot of the code will get irrelevant sooner or later. By the time of writing this the currently official version is 0.6.1 but I’m working on trunk towards 0.7.0.

Here’s a description of the steps I took and things I learned.

Download, configure, run…

First you need to download the code and run unit tests. If you use eclipse, idea, netbeans, vi, emacs and what not, you want to configure it. That was easy. There’s more here.

Reading

Next you want to read some of the background material, depending on what part exactly you want to work on. I wanted to understand the read path, write path and how values are deleted, so I read the following documents about 5 times each. Yes, 5 times. Each. They are packed with information and I found myself absorbing a few more details each time I read. I used to read the document, get back to the source code, make sure I understand how the algorithm maps to the methods and classes, reread the document, reread the source code, read the unit tests (and run them, with a debugger) etc. Here are the docs.

http://wiki.apache.org/cassandra/ArchitectureInternals

SEDA paper

http://wiki.apache.org/cassandra/HintedHandoff

http://wiki.apache.org/cassandra/ArchitectureAntiEntropy

http://wiki.apache.org/cassandra/ArchitectureSSTable

http://wiki.apache.org/cassandra/ArchitectureCommitLog

http://wiki.apache.org/cassandra/DistributedDeletes

I also read the google BigTable paper and the fascinating Amazon’s Dynamo paper, but that was a long time ago. They are good as background material, but not required to understand actual bits of code.

Well, after having read all this I was starting to get a clue what can be done and how but I still didn’t feel I’m at the level of really coding new features. After reading through the code a few times I realized I’m kind of stuck and still don’t understand things like “how do values really get deleted”, which class is responsible for which functionality, what stages are there and how is data flowing between stages, or “how can I mark and entire column family as deleted”, which is what I really wanted to do with the truncate operation.

Stages

Cassandra operates in a concurrency model described by the SEDA paper. This basically means that, unlike many other concurrent systems, an operation, say a write operation, does not start and end by the same thread. Instead, an operation starts at one thread, which then passes it to another thread (asynchronously), which then passes it to another thread etc, until it ends. As a matter of fact, the operation doesn’t exactly flow b/w threads, it actually flows b/w stages. It moves from one stage to another. Each stage is associated with a thread pool and this thread pool executes the operation when it’s convenient to it. Some operations are IO bound, some are disk or network bound, so “convenience” is determined by resource availability. The SEDA paper explains this process very well (good read, worth your time), but basically what you gain by that is higher level of concurrently and better resource management, resource being CPU, disk, network etc.

So, to understand data flow in cassandra you first need to understand SEDA. Then you need to know which stages exist in cassandra and exactly does the data flow b/w them.

Fortunately, to get you started, a partial list of stages is present at the StageManager class:

public final static String READ_STAGE = "ROW-READ-STAGE";
public final static String MUTATION_STAGE = "ROW-MUTATION-STAGE";
public final static String STREAM_STAGE = "STREAM-STAGE";
public final static String GOSSIP_STAGE = "GS";
public static final String RESPONSE_STAGE = "RESPONSE-STAGE";
public final static String AE_SERVICE_STAGE = "AE-SERVICE-STAGE";
private static final String LOADBALANCE_STAGE = "LOAD-BALANCER-STAGE";

I won’t go into detail about what each and every stage is responsible for (b/c I don’t know…) but I can say that, in short, we have the ROW-READ-STAGE which takes part in the read operation, the ROW-MUTATION-STAGE which takes part in the write and delete operations, the AE-SERVICE-STAGE which is responsible for anti-entropy. This is not a comprehensive list of stages, depending on the code path you’re interested in, you may find more along the way. For example, browsing the file ColumnFamilyStore you’ll find some more stages, such as FLUSH-SORTER-POOL, FLUSH-WRITER-POOL and MEMTABLE-POST-FLUSHER. In Cassandra stages are identified by instances of the ExecutorService, which is more or less a thread pool and they all have all-caps names, such as MEMTABLE-POST-FLUSHER.

To visualize that I created a diagram that mixes both classes and stages. This isn’t valid UML, but I think it’s a good way to look at how data flows in the system. This is not a comprehensive diagram of all classes and all stages, just the ones that were interesting to me.


yUML source

Debugging

Reading through the code using a debugger, while running a unit-test is an awesome way to get things into your head. I’m not a huge fan of debuggers, but one thing they are good at is learning a new codebase by singlestepping into unit tests. So what I did was to run the unit-tests while single stepping into the code. That was awesome. I also ran the unit tests for Hector, which uses the thrift interface and spawn an embedded cassandra server so they were right to the point, user friendly and eye opening.

Class Diagrams

Next thing I did is use a tool to extract class diagrams from the existing codebase. That was not a great use of my time.

Well, the tool I used wasn’t great, but that’s not the point. The point is that cassandra’s codebase is written in such way that class diagrams help very little in understanding it. UML class diagrams are great for object oriented design. The essence of them is the list of classes, class members and their relationships. For example if a class A has a list of Bs, so you can draw that in a UML class diagram such that A is an aggregation of Bs and just by looking at the diagram you learn a lot. For example, an Airplane has a list of Passengers.

Cassandra is a complex system with solid algorithmic background and excellent performance, but, to be honest, IMO from the sole perspective of good oo practice, it isn’t a good case study… Its classes contain many static methods and members and in many cases you’d see one class calling other static method of another class, C style, therefore I found that class diagrams, although they are somewhat helpful at getting a visual sense of what classes exist and learn roughly manner about their relationships, are not so helpful.

I ditched the class diagrams and continued to the next diagram – sequence diagrams.

Sequence Diagrams

Sequence diagrams are great at abstracting and visualizing interactions b/w entities. In my case an entity may either be a class, or a STAGE, or a thrift client. Luckily with sequence diagrams you don’t have to be too specific and formal about the kind of entities are used in it, you just represent them all as happy actors (at least, I allow myself to do that, I hope the gods of UML will forgive).

The following diagrams were produced by running Hector‘s unit tests and using an embedded cassandra server (single node). The diagrams aren’t generic, they describe only one possible code path while there could be many, but I preferred keeping them as simple as possible even in the cost of small inaccuracies.

I used a simple online sequence diagram editor at http://www.websequencediagrams.com to generate them.

Read Path

note left of CassandraServer: Read Path

CassandraServer -> StorageProxy: readProtocol
StorageProxy -> weakReadLocal: READ-STAGE.call

weakReadLocal -> SliceByNamesReadCommand: getRow
SliceByNamesReadCommand -> Table: getRow
Table -> ColumnFamilyStore: getColumnFamily
ColumnFamilyStore -> QueryFilter: collectCollatedColumns
QueryFilter -> ColumnFamilyStore:
ColumnFamilyStore -> ColumnFamilyStore: removeDeleted
ColumnFamilyStore -> Table:
Table -> SliceByNamesReadCommand:
SliceByNamesReadCommand -> weakReadLocal:

weakReadLocal -> StorageProxy:
StorageProxy -> CassandraServer:

Write Path

note left of CassandraServer: Write Path
CassandraServer -> StorageProxy: mutateBlocking

note over StorageProxy: async
StorageProxy --> StorageProxy: MUTATION-STAGE call
StorageProxy -> RowMutation: run

RowMutation -> Table: apply

note over Table, CommitLog: async
Table --> CommitLog: COMMIT-LOG-WRITER add
CommitLog -> CommitLogSegment: write
CommitLogSegment -> CommitLog: 

Table -> ColumnFamilyStore: apply
ColumnFamilyStore -> Memtable: put
Memtable -> Memtable: resolve
Memtable -> ColumnFamilyStore:
ColumnFamilyStore -> Table:
Table -> RowMutation:
RowMutation -> StorageProxy:
StorageProxy --> StorageProxy: signal
StorageProxy -> CassandraServer:

Table is a Keyspace

One final note: As user of cassandra I use the terms Keyspace, ColumnFamily, Column etc. However, the codebase is packed with the term Table. What are Tables?… As it turns out, a Table is actually a Keyspace… just keep this in mind, that’s all.

Learning the codebase was a large and satisfying task, I hope this writing helps you get up and running as well.


JMX in Hector

Hector is a Java client for Cassandra I’ve implemented and have written about before (here and here).

What I haven’t written about is its extensive JMX support, which makes it really unique, among other properties such as failover and really simple load balancing. JMX support in hector isn’t really new, but it’s the first time I have the chance to write writing about it.

JMX is Java’s standard way for monitoring applications. The default thrift cassandra client provides no JMX support at all so I figured you have to be crazy to run a cassandra client at such a high scale without being able to monitor it.

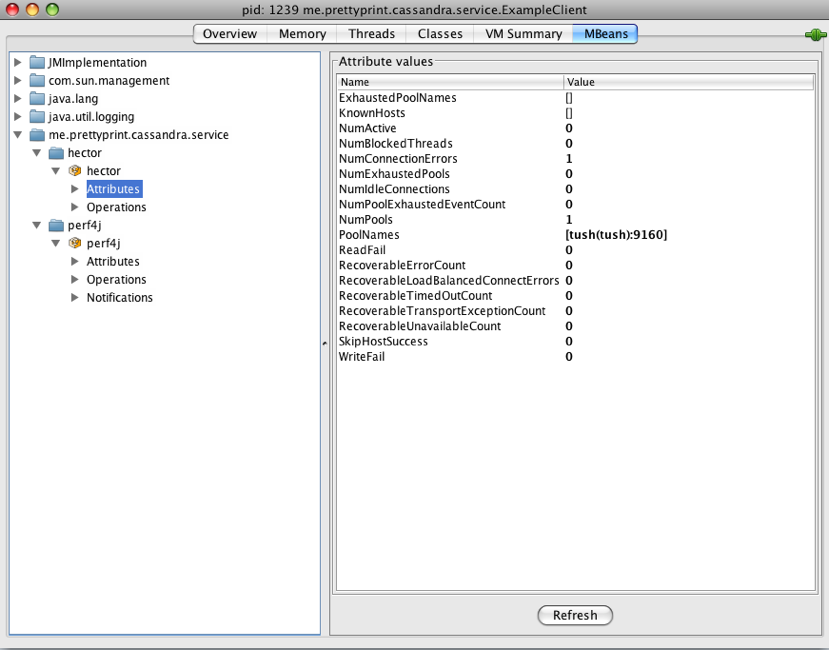
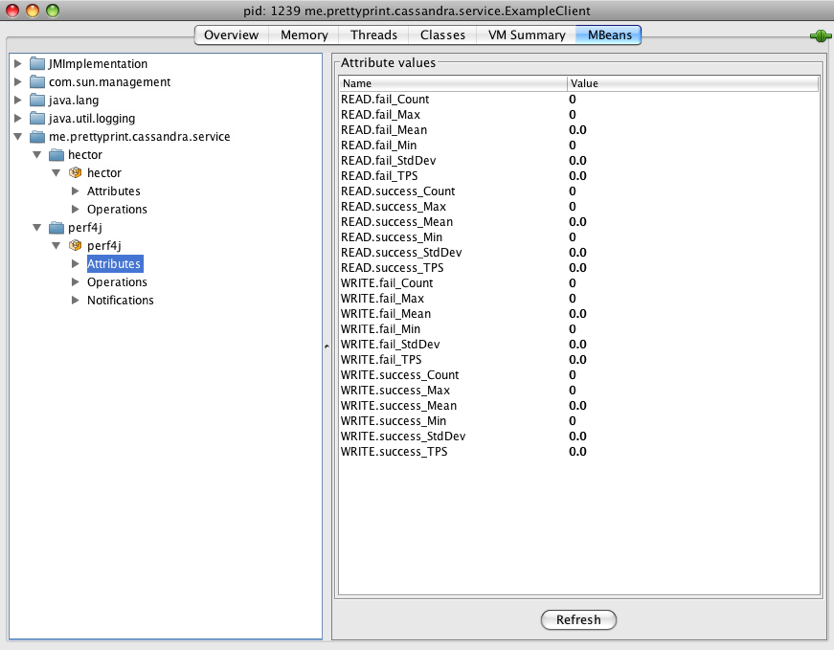
Here’s the list of JMX attributes provided by hector

WriteFail - Number of failed write operations.
ReadFail - Number of failed read operations
RecoverableTimedOutCount - Number of recoverable TimedOut
  exceptions. Those exceptions may happen when certain nodes
  are under heavy load that they can't provide the service
RecoverableUnavailableCount - Number of recoverable
  Unavailable exceptions
RecoverableTransportExceptionCount - Number of recoverable
  Transport exceptions
RecoverableErrorCount - Total number of recoverable errors.
SkipHostSuccess - Number of times that a successful skip-host
  (failover) has occurred.
NumPoolExhaustedEventCount - Number of times threads have
  encountered the pool-exhausted state (and were blocked)
NumPools - Number of connections pools.
  This is also the number of unique hosts in the
   ring that this client has communicated with.
  The number may be one or more, depending on the load balance
  policy and failover attempts.
PoolNames - The list of known pools
NumIdleConnections - Number of currently idle connections
  (in all pools)
NumActive - number of currently active connections (all pools)
NumExhaustedPools - Number of currently exhausted
  connection pools.
RecoverableLoadBalancedConnectErrors - Number of recoverable
  load-balance connection errors.
ExhaustedPoolNames - The list of exhausted connection pools.
NumBlockedThreads - Number of currently blocked threads.
NumConnectionErrors - Number of connection errors
  (initial connection to the ring for retrieving metadata)
KnownHosts - the list of known hosts in the ring.
  This list will be used by the client in case failover is required.
updateKnownHosts - This is an operation that may be invoked
   by an admin to tell the client to update its list of known hosts.
  Usually this is done after the ring configuration has changed.

Performance Counters: (I used the mechanics of perf4j to implement those)

READ.success_TPS - Total Read Transactions Per Second
  (measured as the average over the last 10 seconds).
READ.success_Mean - The Mean time of successful read requests
  over the last 10 seconds.
READ.success_Min - Time in millisec of the fastest successful
  read operation (over the last 10 seconds)
READ.success_Max - Time in millisec of the slowest read
  (over the last 10 seconds)
READ.success_StdDev - Standard deviation of time of successful read
  operations (over the last 10 seconds)
WRITE.success_TPS - Total write transactions per second over
  (over the last 10 seconds).
WRITE.success_Mean - ...
WRITE.success_Min
WRITE.success_Max
WRITE.success_StdDev
READ.fail_TPS
READ.fail_Mean
READ.fail_Min
READ.fail_Max
READ.fail_StdDev
WRITE.fail_TPS
WRITE.fail_Mean
WRITE.fail_Min
WRITE.fail_Max
WRITE.fail_StdDev

This looks like this in jconsole (ignore the zeros, it’s not real data…)


Load balancing and improved failover in Hector

Balance the load, woman!

I’ve added a very simple load balancing feature, as well as improved failover behavior to Hector. Hector is a Java Cassandra client, to read more about it please see my previous post Hector – a Java Cassandra client.

In version 0.5.0-6 I added poor-man’s load balancing as well as improved failover behavior.

The interface CassandraClientPool used to have this method for obtaining clients:

/**
 * Borrows a client from the pool defined by url:port
 * @param url
 * @param port
 * @return
 */
CassandraClient borrowClient(String url, int port)
    throws IllegalStateException, PoolExhaustedException, Exception;

Now with the added LB and failover it has:

/**
 * Borrow a load-balanced client, a random client from the array of given client addresses.
 *
 * This method is typically used to allow load balancing b/w the list of given client URLs. The
 * method will return a random client from the array of the given url:port pairs.
 * The method will try connecting each host in the list and will only stop when there's one
 * successful connection, so in that sense it's also useful for failover.
 *
 * @param clientUrls An array of "url:port" cassandra client addresses.
 *
 * @return A randomly chosen client from the array of clientUrls.
 * @throws Exception
 */
CassandraClient borrowClient(String[] clientUrls) throws Exception;

And usage looks like that:

// Get a connection to any of the hosts cas1, ca2 or cas3
CassandraClient client = pool.borrowClient(new String[] {"cas1:9160", "cas2:9160", "cas3:9160"});

So, when calling borrowClient(String[]) the method randomly chooses any of the clients in the array and connects to it. That’s what I call poor man’s load balancing, just plain dumb random, not real load balancing. By all means, true load balancing which takes into account performance measurements such as response time and throughput is infinitely better than the plain random selection I’m employing here and in my opinion should be left out for your ops folks to deal with and not to the program, however, if you only need a very simplistic approach of random selection, then this method may suite your needs.

A nice side effect of using this method is improved failover. In previous versions hector implemented failover, but in order to find out about the ring structure it had to connect to at least one host in the ring first and query it to learn about the rest. The result was that if a new connection is made and it’s so unfortunate that this new connections is made to unavailable host, then this new client cannot connect to the host to learn about other live hosts so it fails right away. With this new method which sends an array of hosts the client keeps connecting to hosts in the list in random order until it finds one that’s up. In the example above the client may choose to connect to cas2 first; if cas2 is down it’ll try to connect to (say) cas3 and if cas3 is also down it’ll try to connect to cas1; only if all three hosts are down will it give up and return an error. Failing to connect to hosts is considered an error, but a recoverable error, so it’s transparent to the client of hector but is reported to JMX and has its own special counter (RecoverableLoadBalancedConnectErrors).


Hector – a Java Cassandra client

UPDATE 3: Comments are closed now and for the sake of information reuse, please post all your hector questions to the mailing list hector-users@googlegroups.com and please subscribe to it as well.

UPDATE: I added a downloads section, so you may simply download the jar and sources if you’re not into git or maven.

UPDATE 2: I added license clarification; the license it MIT, which is the most permissive license I know of and basically lets you do anything with the software: use it commercially or uncommercially, copy it, fork it (but I’ll be happy to accept patches and committers) and whatnot. I added a LICENSE file and over time I’ll add that block of comment to every file.

In the Greek Mythology, Hector was the builder of Troy, the greatest warrior ever and brother of Cassandra.

Nowdays, Cassandra is a high scale database and Hector is the Java client I’ve written for it.

Over the last couple of days I got the the conclusion that the java client I’ve been using so far to speak to cassanrda wasn’t satisfactory. I used the one simply called cassandra-java-client, which is a good start but had some shortcomings I could just not live with (no support for Cassandra v0.5, no JMX and no failover). So I’ve written my own.

For anyone not familiar with cassanra, it’s client API is just a simple thrift client. This means that, unlike other datastore clients such as jdbc etc, the client provided has somewhat limiter functionality; It can sent messages to cassanra, write values and read values of course, but other client goodies required for large scale applications are not provided, features such as monitoring, connection pooling etc. The client I initially used provides connection pooling, which is a very nice start, but I decided it was missing too much so I’d write my own.

As a good open-source citizen, I initially contacted the authors of cassandra-java-client asking their permission to contribute and make the suggested improvements, but after weeks without reply I realized I’ll need to go solo. I started with the concepts captured by the folks who had built the java-client, but pretty soon the code has morphed to be something completely different.

Here’s how code that uses Hector looks like. This is an implementation of a simple distributed hashtable over cassandra. By the virtue of cassandra, this hashtable can grow pretty large:

  /**
   * Insert a new value keyed by key
   * @param key Key for the value
   * @param value the String value to insert
   */
  public void insert(final String key, final String value) throws Exception {
    execute(new Command(){
      public Void execute(final Keyspace ks) throws Exception {
        ks.insert(key, createColumnPath(COLUMN_NAME), bytes(value));
        return null;
      }
    });
  }
 
  /**
   * Get a string value.
   * @return The string value; null if no value exists for the given key.
   */
  public String get(final String key) throws Exception {
    return execute(new Command(){
      public String execute(final Keyspace ks) throws Exception {
        try {
          return string(ks.getColumn(key, createColumnPath(COLUMN_NAME)).getValue());
        } catch (NotFoundException e) {
          return null;
        }
      }
    });
  }
 
  /**
   * Delete a key from cassandra
   */
  public void delete(final String key) throws Exception {
    execute(new Command(){
      public Void execute(final Keyspace ks) throws Exception {
        ks.remove(key, createColumnPath(COLUMN_NAME));
        return null;
      }
    });
  }

Out of the box Cassanra provides a raw thrift client, which is OK, but lacks many features essential to real world clients. I’ve built Hector to fill this gap.

Here are the high level features of Hector, currently hosted at github.

  • A high-level object oriented interface to cassandra. As noted before, Cassandra’s out of the box client is a thrift client, which isn’t always that nice and clean to work with. I wanted to provide higher level and cleaner API. This part was mainly inspired by the mentioned cassandra-java-client. The API is defined in the Keyspace interface. See for example methods such as Keyspace.insert() and keyspace.getColumn()
  • Failover support. Cassandra is a distributed data store and it may handle very well one or several hosts going down. However, out of the box thrift provides no support for failing clients. What it the client is configured to connect a cassandra host that just happened to be down right now? In hector, if a client is connected to one host in the ring and this host goes down, the client will automatically and transparently search for other available hosts to perform its operation before giving up  and returning an error to its user. There are currently 3 ways to configure the failover policy: FAIL_FAST (no retry, just fail if there are errors, nothing smart), ON_FAIL_TRY_ONE_NEXT_AVAILABLE (try one more host before giving up) and ON_FAIL_TRY_ALL_AVAILABLE (try all available hosts before giving up). See CassandraClient.FailoverPolicy.
  • Connection pooling. This is a real necessity for high scale applications. The usual pattern for DAOs (Data Access Objects) is large number of small reads/writes. Clients cannot afford to open a new connection with each and every request, not only because of the overhead in the tcp handshake (thrift uses tcp), but also because of the fact that sockets remain in TIME_WAIT so a client may easily run out of available sockets if it operates fast enough. This part was also inspired by cassandra-java-client but was improved in my version. Hector provides connection pooling and a nice framework that manages all its gory details.
  • JMX support. It’s a widely known fact that applications have a life of their own. You built it to do X but it does Y b/c you didn’t expect Z to happen. Running an application without the ability to monitor it is like walking blindfolded on a dark highway; sooner or later you’ll get hit by something. Hector exposes JMX for many important runtime metrics, such as number of available connections, idle connections, error statistics and more.
  • Support for the Command design pattern to allow clients to concentrate on their business logic and let hector take care of the required plumbing. This is demonstrated in the code above.

I’ve been using hector internally, at outbrain and so far so good. I’d be happy to get the comminuty feedback – API, implementation, features and so on and hope you can find it useful.


Running Cassandra as an embedded service

While developing an application at outbrain, using Cassandra I was looking for a good way to test my app. The application consists of a Cassandra Client package, some Data Access Objects (DAOs) and some bean object that represent the data entities in cassandra. I wanted to test them all.

As unit test tradition goes, my requirement was zero-configuration, zero preparation, no external dependencies, full isolation, fully reproducible results and fast. Database testing has always been a challenge in this perspective, for example when testing SQL clients in java often HSQLDB is used to to mock the database. Cassandra, however, did not have something ready just yet so I had to build it.

One way to go was to setup a cassandra instance just for unit testing. There are many downsides to this approach, such as it’s not zero-configuration, tests need to cleanup before they execute, if two tests are run at the same time by two developers they can collide and change the results in unexpected way, it’s slow… out of the question, not good.

Enter the embedded cassandra server.

With the help of the community I’ve built an embedded cassandra service ideal for unit testing and perhaps other uses. I’ve also built a cleanup utility that helps wipe out all data before the service starts running so the combination of both provides isolation etc. Now each test process runs an in-process, embedded instance of cassandra.

Below is the source code, already committed to cassandra SCM on trunk. If you want to use it for the current stable release(0.5.0) only a small package rename is required (in trunk some classes moved a bit), and it’s presented at the end of the post.

The embedded service:

package org.apache.cassandra.service;
 
import java.io.File;
import java.io.FileOutputStream;
import java.io.IOException;
import java.io.InputStream;
import java.io.OutputStream;
 
import org.apache.cassandra.config.DatabaseDescriptor;
import org.apache.cassandra.io.util.FileUtils;
import org.apache.cassandra.thrift.CassandraDaemon;
import org.apache.thrift.transport.TTransportException;
import org.slf4j.Logger;
import org.slf4j.LoggerFactory;
 
/**
 * An embedded, in-memory cassandra storage service that listens
 * on the thrift interface as configured in storage-conf.xml
 * This kind of service is useful when running unit tests of
 * services using cassandra for example.
 *
 
 * This is the implementation of https://issues.apache.org/jira/browse/CASSANDRA-740
 *
 
 * How to use:
 * In the client code create a new thread and spawn it with its {@link Thread#start()} method.
 * Example:
 *
 *      // Tell cassandra where the configuration files are.
        System.setProperty("storage-config", "conf");
 
        cassandra = new EmbeddedCassandraService();
        cassandra.init();
 
        // spawn cassandra in a new thread
        Thread t = new Thread(cassandra);
        t.setDaemon(true);
        t.start();
 
 *
 * @author Ran Tavory (rantav@gmail.com)
 *
 */
public class EmbeddedCassandraService implements Runnable
{
 
    CassandraDaemon cassandraDaemon;
 
    public void init() throws TTransportException, IOException
    {
        cassandraDaemon = new CassandraDaemon();
        cassandraDaemon.init(null);
    }
 
    public void run()
    {
        cassandraDaemon.start();
    }
}

The data cleaner:

package org.apache.cassandra.contrib.utils.service;
 
import java.io.File;
import java.io.IOException;
import java.util.HashSet;
import java.util.Set;
 
import org.apache.cassandra.config.DatabaseDescriptor;
import org.apache.cassandra.io.util.FileUtils;
 
/**
 * A cleanup utility that wipes the cassandra data directories.
 *
 * @author Ran Tavory (rantav@gmail.com)
 *
 */
public class CassandraServiceDataCleaner {
 
    /**
     * Creates all data dir if they don't exist and cleans them
     * @throws IOException
     */
    public void prepare() throws IOException {
        makeDirsIfNotExist();
        cleanupDataDirectories();
    }
 
    /**
     * Deletes all data from cassandra data directories, including the commit log.
     * @throws IOException in case of permissions error etc.
     */
    public void cleanupDataDirectories() throws IOException {
        for (String s: getDataDirs()) {
            cleanDir(s);
        }
    }
    /**
     * Creates the data diurectories, if they didn't exist.
     * @throws IOException if directories cannot be created (permissions etc).
     */
    public void makeDirsIfNotExist() throws IOException {
        for (String s: getDataDirs()) {
            mkdir(s);
        }
    }
 
    /**
     * Collects all data dirs and returns a set of String paths on the file system.
     *
     * @return
     */
    private Set getDataDirs() {
        Set dirs = new HashSet();
        for (String s : DatabaseDescriptor.getAllDataFileLocations()) {
            dirs.add(s);
        }
        dirs.add(DatabaseDescriptor.getLogFileLocation());
        return dirs;
    }
    /**
     * Creates a directory
     *
     * @param dir
     * @throws IOException
     */
    private void mkdir(String dir) throws IOException {
        FileUtils.createDirectory(dir);
    }
 
    /**
     * Removes all directory content from file the system
     *
     * @param dir
     * @throws IOException
     */
    private void cleanDir(String dir) throws IOException {
        File dirFile = new File(dir);
        if (dirFile.exists() &amp;&amp; dirFile.isDirectory()) {
            FileUtils.delete(dirFile.listFiles());
        }
    }
}

And an example test that uses both:

package org.apache.cassandra.contrib.utils.service;
 
import static org.junit.Assert.assertEquals;
import static org.junit.Assert.assertNotNull;
 
import java.io.IOException;
import java.io.UnsupportedEncodingException;
 
import org.apache.cassandra.service.EmbeddedCassandraService;
import org.apache.cassandra.thrift.Cassandra;
import org.apache.cassandra.thrift.ColumnOrSuperColumn;
import org.apache.cassandra.thrift.ColumnPath;
import org.apache.cassandra.thrift.ConsistencyLevel;
import org.apache.cassandra.thrift.InvalidRequestException;
import org.apache.cassandra.thrift.NotFoundException;
import org.apache.cassandra.thrift.TimedOutException;
import org.apache.cassandra.thrift.UnavailableException;
import org.apache.thrift.TException;
import org.apache.thrift.protocol.TBinaryProtocol;
import org.apache.thrift.protocol.TProtocol;
import org.apache.thrift.transport.TSocket;
import org.apache.thrift.transport.TTransport;
import org.apache.thrift.transport.TTransportException;
import org.junit.BeforeClass;
import org.junit.Test;
 
/**
 * Example how to use an embedded and a data cleaner.
 *
 * @author Ran Tavory (rantav@gmail.com)
 *
 */
public class CassandraServiceTest {
 
    private static EmbeddedCassandraService cassandra;
 
    /**
     * Set embedded cassandra up and spawn it in a new thread.
     *
     * @throws TTransportException
     * @throws IOException
     * @throws InterruptedException
     */
    @BeforeClass
    public static void setup() throws TTransportException, IOException,
            InterruptedException {
        // Tell cassandra where the configuration files are.
        // Use the test configuration file.
        System.setProperty("storage-config", "../../test/conf");
 
        CassandraServiceDataCleaner cleaner = new CassandraServiceDataCleaner();
        cleaner.prepare();
        cassandra = new EmbeddedCassandraService();
        cassandra.init();
        Thread t = new Thread(cassandra);
        t.setDaemon(true);
        t.start();
    }   
 
    @Test
    public void testInProcessCassandraServer()
            throws UnsupportedEncodingException, InvalidRequestException,
            UnavailableException, TimedOutException, TException,
            NotFoundException {
        Cassandra.Client client = getClient();
 
        String key_user_id = "1";
 
        long timestamp = System.currentTimeMillis();
        ColumnPath cp = new ColumnPath("Standard1");
        cp.setColumn("name".getBytes("utf-8"));
 
        // insert
        client.insert("Keyspace1", key_user_id, cp, "Ran".getBytes("UTF-8"),
                timestamp, ConsistencyLevel.ONE);
 
        // read
        ColumnOrSuperColumn got = client.get("Keyspace1", key_user_id, cp,
                ConsistencyLevel.ONE);
 
        // assert
        assertNotNull("Got a null ColumnOrSuperColumn", got);
        assertEquals("Ran", new String(got.getColumn().getValue(), "utf-8"));
    }
 
    /**
     * Gets a connection to the localhost client
     *
     * @return
     * @throws TTransportException
     */
    private Cassandra.Client getClient() throws TTransportException {
        TTransport tr = new TSocket("localhost", 9170);
        TProtocol proto = new TBinaryProtocol(tr);
        Cassandra.Client client = new Cassandra.Client(proto);
        tr.open();
        return client;
    }
}

To use this source code in v0.5.0 a small package rename is required:
org.apache.cassandra.io.util.FileUtils => org.apache.cassandra.utils.FileUtils
org.apache.thrift.transport.TTransportException => org.apache.transport.TTransportException
org.apache.cassandra.thrift.CassandraDaemon => org.apache.cassandra.CassandraDaemon

One nifty detail: When running multiple tests serially, make sure to spawn each test in a separate JVM (fork mode) since cassandra doesn’t shut down all threads immediately. Running each in separate jvm ensures the previous test dies before the next one begins.